Introduction
This project describes the classification model created to predict the most probable task performed by a participant, in an experiment involving thousand participants performing five different tasks, across two different measures of evaluation. Bayes theorem was used to determine the most probable task a participant would perform, given the measure of evaluation. This probability was evaluated using central limit theorem, using the mean and standard deviation of the data. This was repeated for different versions of the measurement data. The classification rate in each case was recorded and observations were made.
About the dataset
The given dataset contains data of 1000 participants performing 5 different tasks. Two measurements F1 and F2 were recorded. Each row in table F1 and F2 corresponds to the tasks performed, whereas each column contains information of each task.
Methodology
There were four cases to deal with, to identify the best Bayesian classifier. Two cases involved the use of table F1 and F2 respectively. The third case involved the use of a normalized version of F1, labelled as Z1. The fourth case involved the use of a multivariate normal distribution, which consists of Z1 and F2. The following steps were performed for the first three cases:
- Split the dataset into train and test dataset containing 100 and 900 observations respectively.
- Calculate the mean and standard deviation of the train data, for each task.
- Create an array containing the indices 1,2,3,4 and 5 replicated across 900 rows. This will be referred to as true class values.
- Calculate p-values for each observation in the test data using each mean and standard deviation obtained from the previous step, for each task.
- Select the index (task number) of the maximum p-value out of the five p-values, for each observation in the test data. This array will be referred to as predictions.
- Calculate the classification accuracy and error rate by comparing the true class values and predictions.
In the last case, that is, where the data contains both Z1 and F2, two probabilities were calculated. One set of p-values were calculated using the mean and standard deviation of Z1 (which was previously computed), whereas another set of p-values were calculated using the mean and standard deviation of F2. The final probability of each task was calculated by multiplying the above two p-values, since the distributions were independent. Now step 5 and 6 (as described above) were followed for this data.
Observations
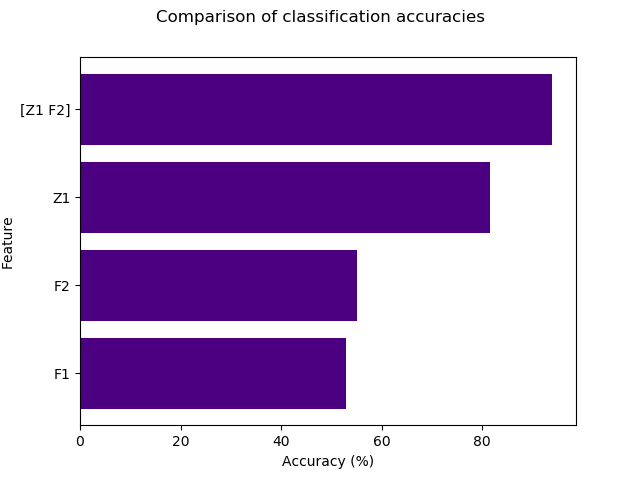
The classification accuracy and error rate for each case is tabulated in the following table.
| Dataset used | Classification Accuracy | Error rate |
|---|---|---|
| F1 | 0.53 | 0.47 |
| F2 | 0.551 | 0.448 |
| Z1 | 0.816 | 0.183 |
| Z1, F2 | 0.939 | 0.06 |
It can be observed that the classification accuracy is poor for F1 and F2. This can be attributed to the absence of normally distributed data, that is, the scale of features is different for each class.
In the case where Z1 is used, a classification accuracy of 0.816 is obtained. This high accuracy can be attributed to the normalization of the data. Normalizing the data makes the classifier less sensitive to the scale of the features, and hence yields better consistency and accuracy. When both F1 and Z2 are used, we get an even better accuracy, which is due to the presence of highly normalized multivariate data.
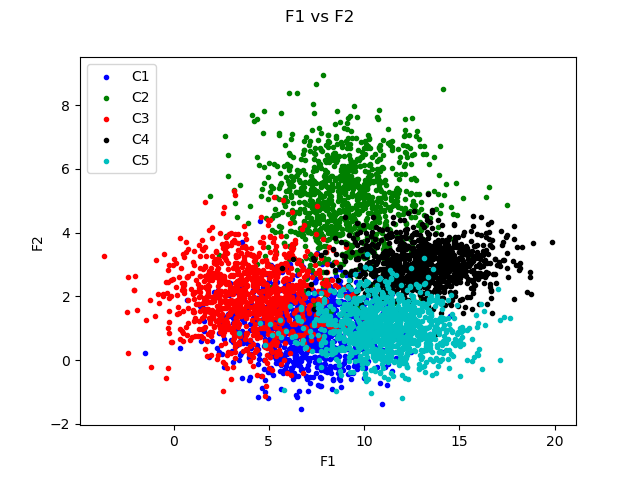
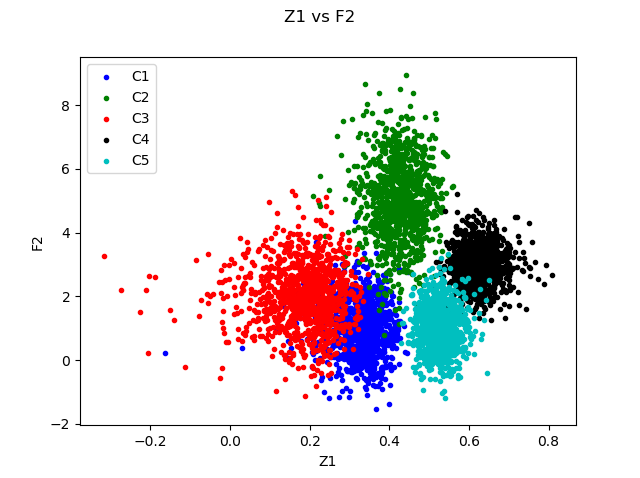
The following figures represent the distribution of F1 versus F2, and Z1 vs F2 respectively. It can be observed that each class is more distinguishable in Figure 4 when compared to Figure 3. To elaborate, the scale of each feature (task) is the same. This can again be attributed to the normalization of data.


Comparison of classification accuracies

Concluding remarks
In this project, the importance of normalization and performance of Bayesian classifiers were observed. If the data used in the classifier has independent features, then the classifier yields a good accuracy. It can be said that a multivariate classifier yields better accuracy compared to a univariate classifier, since a large number of data points and classes are used for prediction.
Check it out
The code can be viewed here.